
1. Introduction
During a recent Breakfast Club meeting, the Virginia 2024 Election Compendium by Seth Keshel was introduced and discussed. An additional meeting of interested members was convened to address concerns regarding the voter erosion of the Republican Party in York County, Virginia. The discussion centered around defining a strategic path forward to mitigate this trend, supported by several key documents that were developed and reviewed during the meeting:
- Summary Analysis of the Virginia 2024 Election Compendium by Capt. Seth Keshel
This analysis provided a broad overview of statewide election trends, with an emphasis on identifying areas of opportunity and risk for Republican candidates in Virginia. Capt. Keshel’s insights highlighted shifts in voter behavior, precinct-level turnout patterns, and potential factors contributing to recent election outcomes. - Review of Same-Day Voter Registration and Strategic Approach
This document explored the implementation of same-day voter registration, assessing its potential impact on voter turnout and party dynamics. The discussion included strategies to maximize Republican engagement under this framework, along with anticipated challenges. - York County Republican Party Path Forward Document
This comprehensive report analyzed York County’s precinct demographics and voting behaviors from past elections, providing precinct-specific insights into voter preferences, turnout rates, and shifts in party alignment. The document served as a foundation for tailoring outreach efforts and voter engagement strategies. - Draft Virginia Legislative Proposal for Same-Day Voter Registration
A preliminary legislative proposal was introduced, outlining the requirements, potential benefits, and risks associated with adopting same-day voter registration in Virginia. The proposal aimed to align with broader party goals while addressing procedural considerations.
2. Meeting Key Action Item: Data-Driven Voter Trend Analysis
A major outcome of the meeting was the recognition of the need for robust, precinct-level data to assess voting trends accurately. Specifically, the group identified a need to determine the historical trajectory of Republican versus Democrat voters across York County. This data would allow for precise identification of precincts where Republican support is declining, holding steady, or increasing.
To address this, the meeting participants emphasized the importance of obtaining authoritative election data from the Virginia Public Access Project (VPAP) or the Virginia Department of Elections (https://www.elections.virginia.gov/resultsreports/election-results/). By focusing on York County precinct-level results from recent election cycles, the Republican Party can conduct a detailed, data-driven analysis to better understand voter behavior and develop informed strategies for future elections.
3. Analysis Methodology
- Data Extraction from Official Sources
York County precinct data was sourced from the General Election spreadsheets available on the Virginia Department of Elections website. Election years 2020–2024 were selected to provide a relevant sample time frame showing a year-by-year trend. An initial attempt to use Virginia Public Access Project (VPAP) data was abandoned after identifying inconsistencies; VPAP’s use of aggregated percentages introduced assumptions about voter populations that were unsuitable for this analysis and skewed the results of a direct comparison of voter data in contested elections. - Selection of Contested Elections
Only contested elections, where both a Democrat and a Republican candidate were on the ballot, were included in the analysis. For example, in 2023, Republican Chad Green ran unopposed; therefore, his votes were excluded to avoid skewing the Democrat-Republican vote percentages. Data for races such as Danny Diggs vs. Monty Mason and A.C. Cordoza vs. Jarris Louis Taylor Jr. in precincts like Magruder, Grafton, Tabb, and Bethel were included. Non-partisan elections, such as school board races, were excluded. - Data Processing
Election data for York County was extracted from the General Election spreadsheets for each year. Two additional columns were added to each precinct’s dataset to distinguish and separate Democratic and Republican votes. Total votes for each party were then calculated by precinct. - Summary Table Creation
A summary table was created to record the total Democratic and Republican votes for each precinct. Percentages were calculated for each party by dividing the party’s votes by the combined total of Democratic and Republican votes:- Democrat Percentage = (Democrat Votes ÷ Total Votes)
- Republican Percentage = (Republican Votes ÷ Total Votes).
These percentages were entered into respective columns of the summary table.
- Percentage Difference Calculation
A “Percentage Difference” column was added to the summary table. This column was calculated as:- Percentage Difference of Republicans = (Republican Percentage – Democrat Percentage).
- Percentage Difference of Democrats = (Democrat Percentage – Republican Percentage
This metrics provided the net difference between Republican and Democratic voter percentages for each precinct. The data shown is symmetrical i.e. the same percentages either Plus or Minus since both percentages are calculated using the total voter count.
- Data Visualization through Graphs
Graphs were generated to visualize the percentage difference for each precinct across election years. These graphs plotted the year against the percentage difference, enabling an easy assessment of voter trends over time. - Trendline Analysis
Trendlines were added to each graph to illustrate the direction and degree of change in Republican voter percentages over the analyzed period, highlighting deviations and overall trends. - Overall Trend Analysis
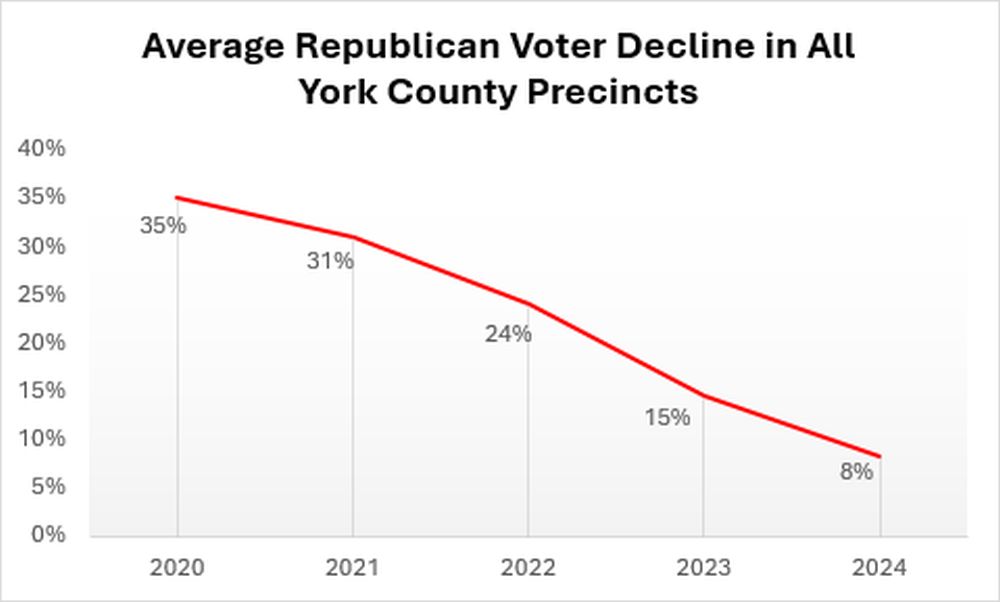
An average of the percentage differences across all precincts was calculated for each year. This average shown in the graph below, provides a county-wide view of the trend in Republican voter performance, revealing the overall direction and rate of voter change in York County.
4. Average Vote Comparison Summary Graph
The graph below shows the decline of Republican Voters and the ascendance of Democrat voters in York County since 2020. The detailed comparison graph by York Precinct is included below.
5. Provisional Ballots
An interesting dynamic that emerged from the analysis were voting trends between the parties relative to provisional ballots. The analysis in the graph shows large variances between the parties year over year. The Republican Party showed signs of progress in the use of provisional ballots in the 2024 election, but statistically the numbers which were added were insignificant.
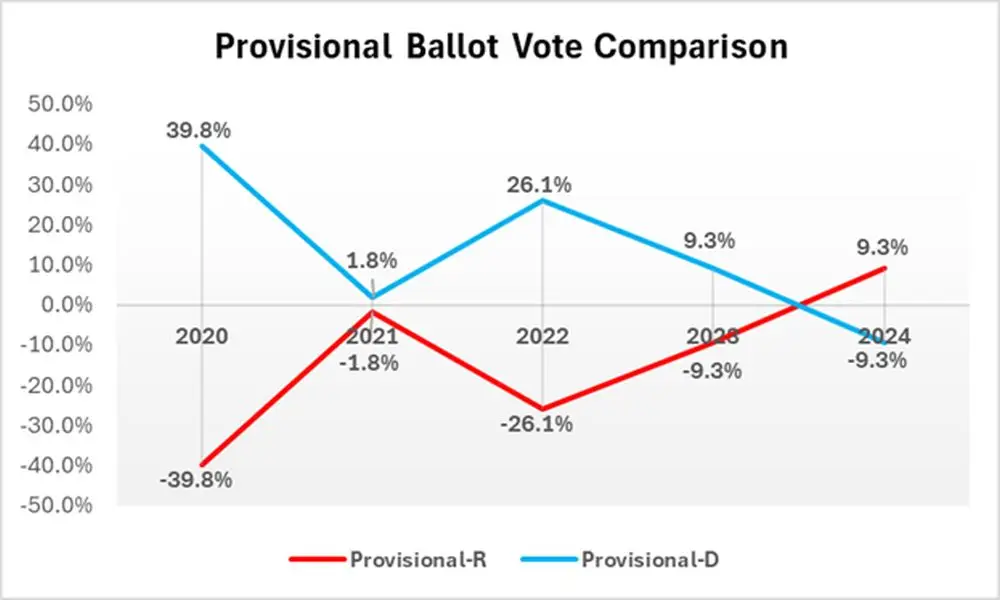
Provisional ballots, which are cast when there are questions about a voter’s eligibility at the polling place, is becoming a critical tool in determining close races. However, the Democratic Party is demonstrating a far more sophisticated and effective use of these ballots as part of their overall election strategy, leveraging them to bolster their voter turnout and secure victories in tightly contested districts.
The Republican Party currently lags in recognizing the full potential of provisional ballots and developing targeted strategies to utilize them effectively. Democratic campaigns in York County are integrating robust systems for identifying and supporting provisional voters, ensuring their ballots are validated and counted where possible. These strategies often include pre-election efforts to educate voters, on-the-ground election-day support for individuals casting provisional ballots, and post-election follow-ups to ensure voters take necessary steps to validate their ballots. Without equivalent measures, the Republican Party risks conceding a significant advantage to Democrats, particularly in swing districts or precincts with competitive races.
Provisional ballot data is included in each of the tables that are shown below. By leveraging this data, the Republican Party can project where improvements are needed and focus resources strategically to close the gap in provisional ballot performance. Failure to address these disparities will likely result in the continued erosion of Republican advantages in competitive districts, further diminishing the party’s ability to maintain or regain electoral ground.
6. Supporting Data
The following tables are derived from the methodology section above and are presented below. Source data references to the authoritative data sources are included below each table from the Virginia Department of Elections to ensure transparency and validation of the analysis.


 7. Republican – Democrat Voter Precinct Comparison Graphs
This analysis includes two sets of voter comparison graphs, condensed into a quad chart format for clearer visualization.
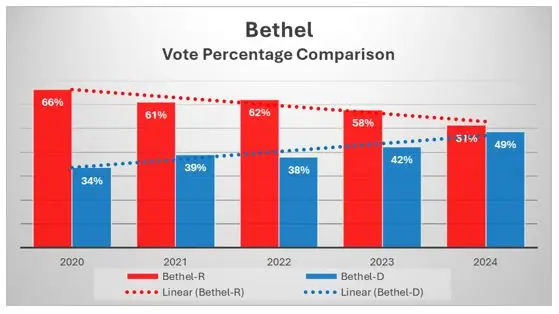
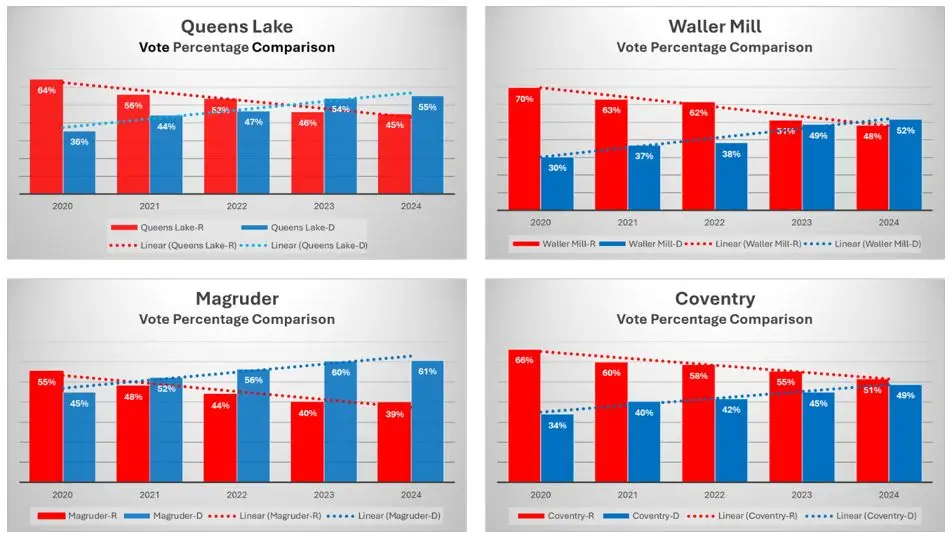
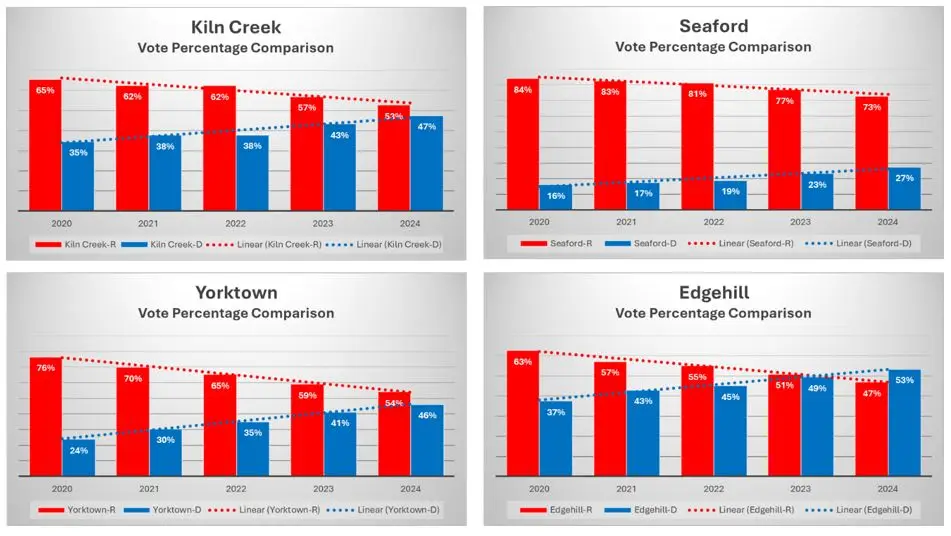
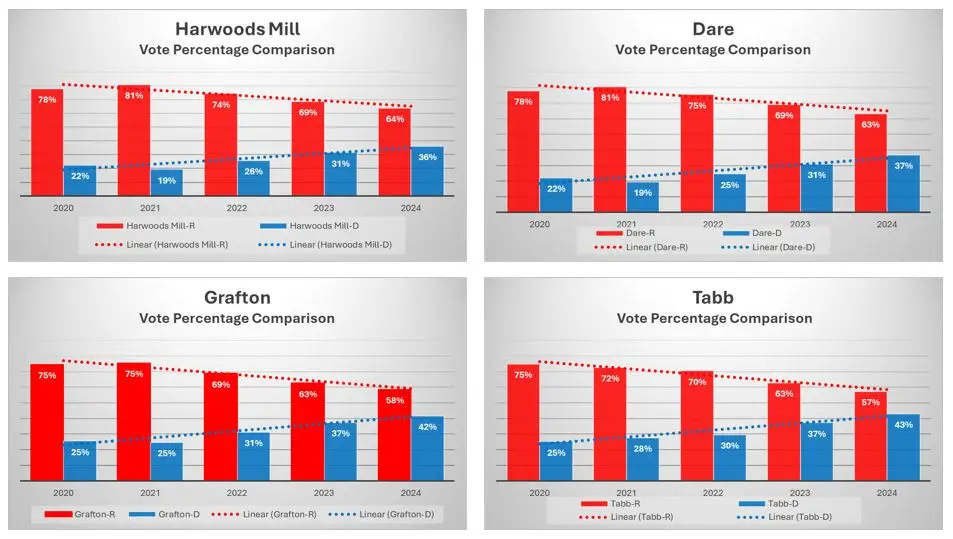
- Precinct Comparison Graphs:
These graphs display the percentage of total votes received by Republican and Democratic candidates from 2020 to 2024. The data, sourced from the tables above, includes trend lines to illustrate year-over-year voting patterns at the precinct level. - Vote Difference Graphs:
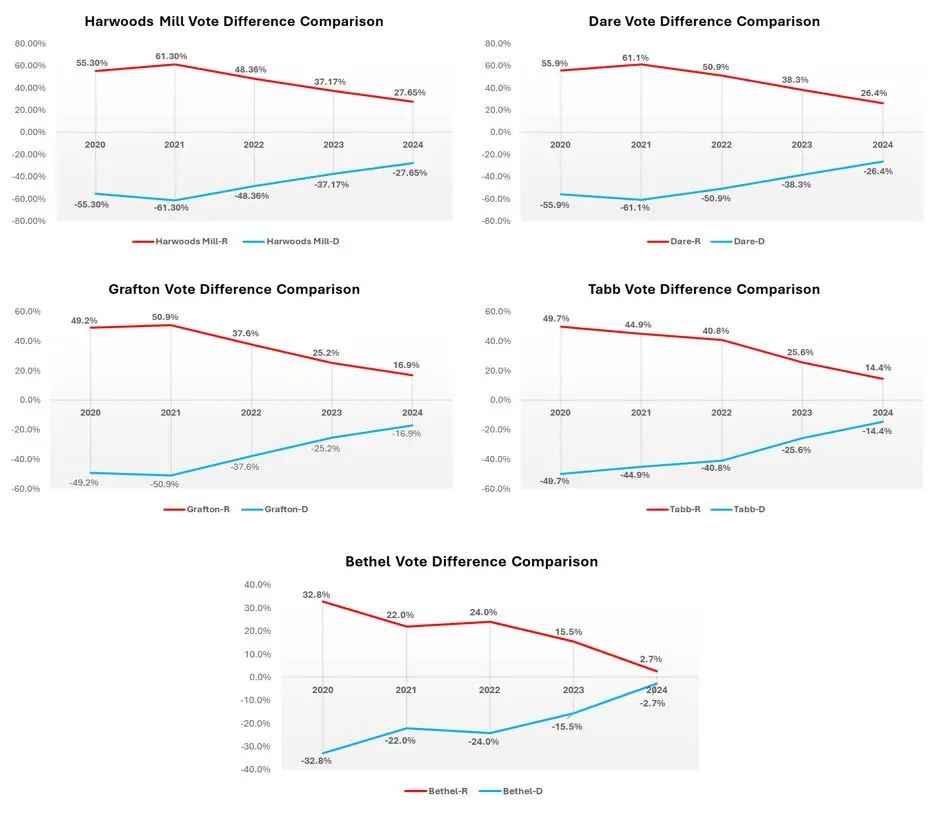
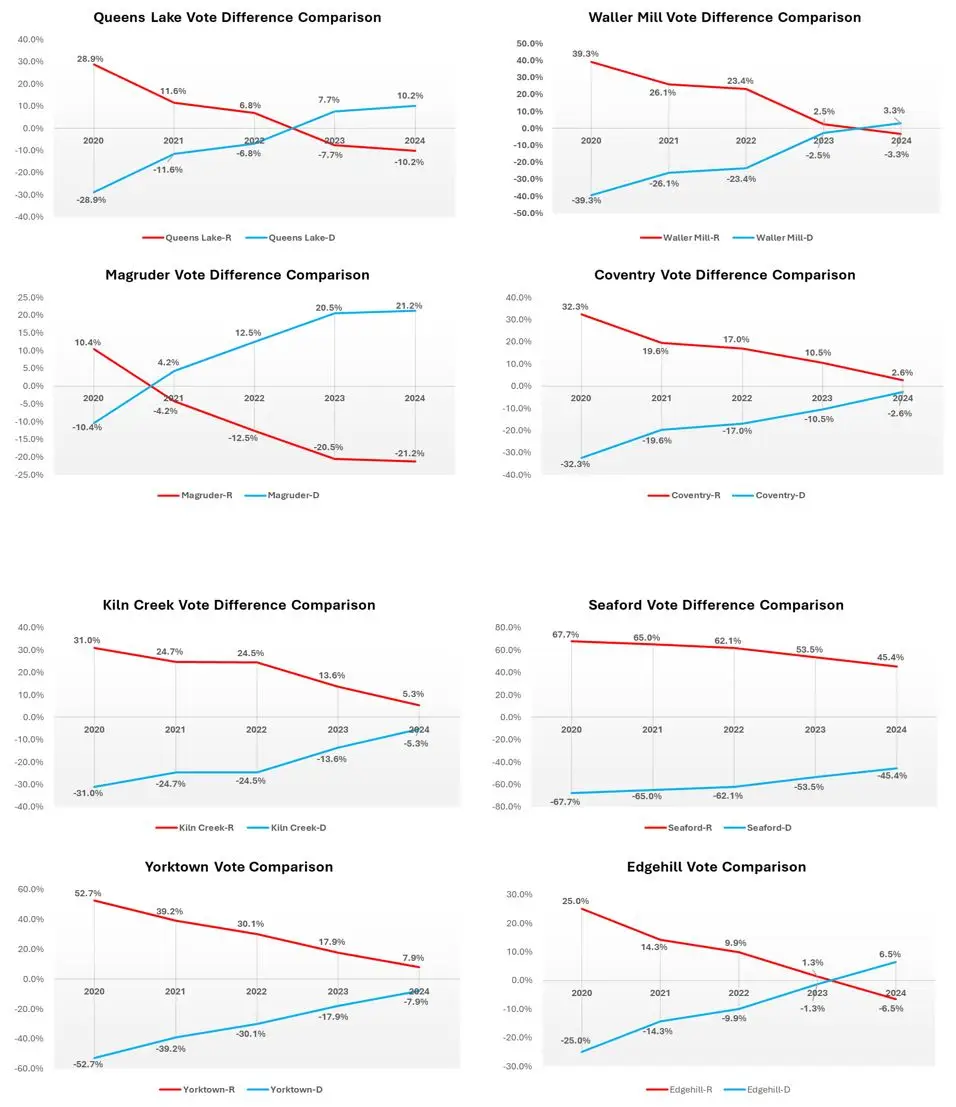
These graphs, derived from the last two columns of the tables, use an expanded scale to highlight changes in voting margins between both parties. This approach provides a clearer view of voting shifts across all districts.
Potential factors influencing these trends fall outside the scope of this analysis and report but should be urgently reviewed by YCRC leadership.
Traditional political party colors are used to distinguish voting trends and improve readability.
Precinct Comparison Graphs
Vote Difference Graphs
8. Swing Precincts
Swing precincts in York County represent critical battlegrounds where Republican and Democratic voter support is closely contested. This report identifies swing precincts based on historical election data and outlines a comprehensive strategy to engage and mobilize voters in these pivotal areas. By addressing trends in voter behavior and leveraging precinct-specific insights, the Republican Party can strengthen its presence and reverse recent declines in electoral performance.
Swing precincts are defined as those where the margin of victory between Republican and Democratic candidates has consistently been narrow, typically within ±5%. These precincts are particularly sensitive to changes in voter turnout, demographics, and campaign strategies, making them key targets for focused engagement.
Based on the data calculated for this report the swing precincts in York County are:
Waller Mill: ± 3.26% (already Democrat, trending for increased Democrat vote)
Coventry: ± 2.65% (trending Democrat)
Kiln Creek: ± 5.27% (close enough and trending Democrat)
Yorktown: ± 7.93% (close and trending Democrat)
Edgehill: ± 6.46 (close and trending Democrat)
Bethel: ± 2.69%
The precincts which have flipped to Democrat include:
Queens Lake – significant Democrat lead
Waller Mill – slight Democrat lead
Magruder – huge Democrat lead
Edgehill – strong Democrat lead, trending Democrat
9. Summary
This report provides a comprehensive analysis of the Republican vote trends in York County, Virginia, focusing on data-driven insights to address voter erosion. Following a meeting of concerned citizens in January 2025, the analysis was conducted to identify the factors contributing to the declining Republican voter base and to develop strategies to reverse this trend.
The report highlights the use of precinct-level data from the Virginia Department of Elections, spanning elections from 2020 to 2024. Only contested races were analyzed to provide a clear comparison between Republican and Democratic voter performance. Graphs and summary tables illustrate the decline in Republican voter percentages and the corresponding rise in Democratic support across the county. The analysis also includes insights into the strategic use of provisional ballots, revealing a gap in Republican efforts compared to the more sophisticated Democratic approach.
Key recommendations emphasize the importance of precinct-specific strategies, enhanced engagement with provisional voters, and the development of data-driven outreach efforts. The report urges Republican leaders to adopt proactive measures to improve voter mobilization and secure electoral gains. Supporting data and visuals provide a foundation for informed decision-making and targeted intervention.
10. Strategic Recommendations:
- Communication: Share this analysis with Republican Party leaders to inform them of the problematic trends in the York County Republican electorate and ensure alignment and support for precinct-specific strategies.
- Swing Precincts: Swing precincts are those where election results have historically been closely contested, with narrow margins between Republican and Democratic votes. Swing precincts were identified above where the margin of victory was within ±5%.
- Conduct a Forensic Analysis: Identify root causes i.e. demographics such as changes in age, income, and education levels may have shifted voting patterns and lower Republican turnout in specific precincts which may have contributed to electoral losses.
- Enthusiasm Gap: Republican voters exhibit lower levels of motivation or commitment to participate in elections compared to their Democratic counterparts or their own historical levels of engagement. This phenomenon often leads to decreased voter turnout, which can significantly impact the party’s performance, particularly in competitive precincts or swing elections.
- Strategic Development: Use the insights gained to refine the York County Republican Party’s voter outreach, engagement, and mobilization efforts, ensuring alignment with precinct-specific demographics and preferences.
- Data-Driven Engagement: Republican leaders are urged to adopt a data-driven approach to voter engagement, focusing on precincts where support has declined most significantly. Insights from the analysis should guide outreach, messaging, and resource allocation.
- Enhanced Provisional Ballot Strategy: The party must develop robust systems to identify and support provisional voters. This includes pre-election education, election-day assistance, and post-election validation efforts to ensure these ballots contribute effectively to overall voter turnout.
- Tailored Outreach and Messaging: Outreach strategies should be aligned with the demographic and voting behavior of each precinct. Leveraging localized data will enable the party to address specific concerns and foster stronger voter connections.
- Precinct Analysis: Continuously monitor and analyze data from swing precincts to adapt strategies and measure progress.
- Resource Allocation: Prioritize funding and campaign resources for precincts with the highest potential for Republican gains.
11. Conclusion
The report underscores the urgency of addressing the declining Republican voter base in York County. By adopting the recommended strategies and leveraging precinct-level insights, the York County Republican Party can improve voter engagement and regain electoral ground. Sharing this analysis with party leadership is a critical next step to align efforts and drive impactful change.
This narrative serves as a strategic resource for the York County Republican Party to address current challenges and implement effective solutions for future elections.